It was Rocktober for the NZX
October saw the New Zealand equity market fall -5.4%, its sharpest monthly fall in several years. Since its all-time high, reached on 7 September 2016, the market has declined (at the date of writing) by -11.4%. It has also been notable that the New Zealand market has recently performed much worse than most of its international peers. So, what could be driving the recent activity, and should we be worried (or at least more worried than normal)?
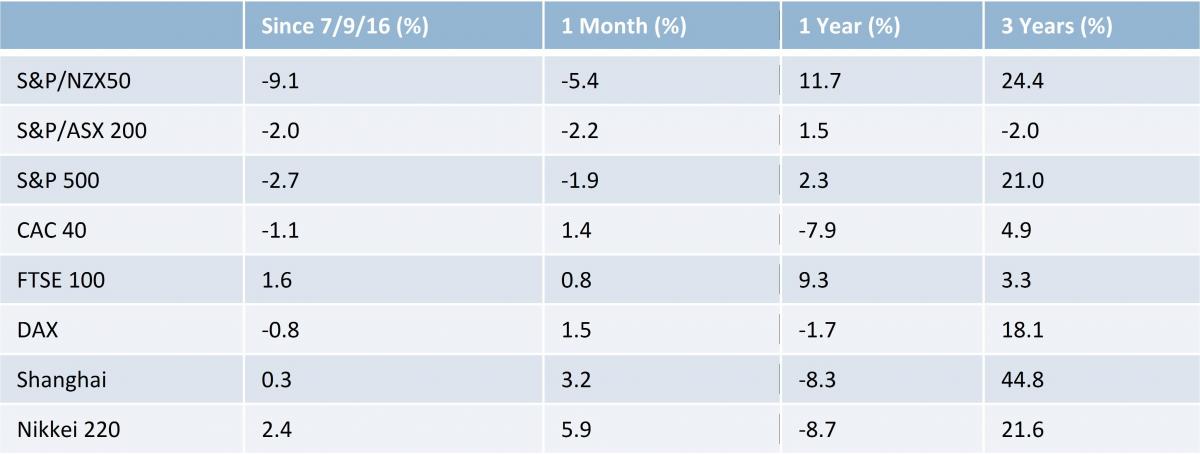
Let’s start by putting recent performance in context. As the table below shows, over all but the most recent period, the New Zealand market has been an excellent performer, bettered over 3 years only by the Shanghai index which in that time has been through one of the most extraordinary bubbles (and partial deflations) in history. As the one year performance numbers show, the real outlier has been the New Zealand’s market strong rise in the earlier part of the year, which has now partially reversed. Note that these numbers show the S&P/NZX50G and the S&P/ASX200G excluding dividends to make comparison with offshore indices like for like - actual returns to investors in local markets are materially higher both absolutely and relatively due to the high level of dividends paid in Australasia.
Although performance over recent periods has been strong, the sell-off has unquestionably been sharp. When speculating on the potential causes we need to be careful, because we can never know with certainty the cause of short term market movements, but there are some facts that are likely to be relevant. Firstly, the market has looked expensive (when share prices are compared to company earnings) for some time – at its recent peak the market price to earnings multiple rose above 20x, more than 20% above its historic average. Secondly, there has been a marked increase in global bond yields, partly driven by a view that the US Federal Reserve will increase interest rates before Christmas. Finally, we know that there has been a lot of offshore participation in the market in recent years with foreign ownership of the S&P/NZX50G now around 50%, up from around 25% three years ago. With a change in global interest rate views it is likely that some offshore owners will be taking their profits from the NZ market.
Notably there hasn’t been a sudden macro-economic shock which has affected the outlook for the performance of local companies. If anything, the earnings outlook has generally been improving as the economy has grown faster than expectations. There are clear exceptions to this of course, in recent weeks we have seen Sky City and Comvita have profit warnings and we have seen both Wynyard and Pumpkin Patch put into receivership. Nor has there been any evidence of panicked selling with the daily value of shares traded within entirely normal ranges and very close to the average over the last 3 years.
Given this constellation of circumstances, a plausible explanation for recent weakness might be that concerns around rising yields have seen some offshore investors reduce their exposure to a market and a currency that appears to have benefitted from the “search for yield”.
If that is the case it seems the risk aversion has been very broad based, and not just focused on higher yielding equities. The table below shows the performance of the top 10 NZ stocks by market capitalisation to 31 of October. Putting aside Sky City (which gave a trading update during October that was both abysmal and mysterious) the selling was fairly indiscriminate. The worst performer was Auckland Airport, a stock that has been trading at a nose bleeding valuation for some time and which pays a relatively low dividend. Startlingly, Spark, one of the highest yielding stocks in the market (it is forecast to pay a cash dividend yield of 6.8%) actually made a positive return over the period!
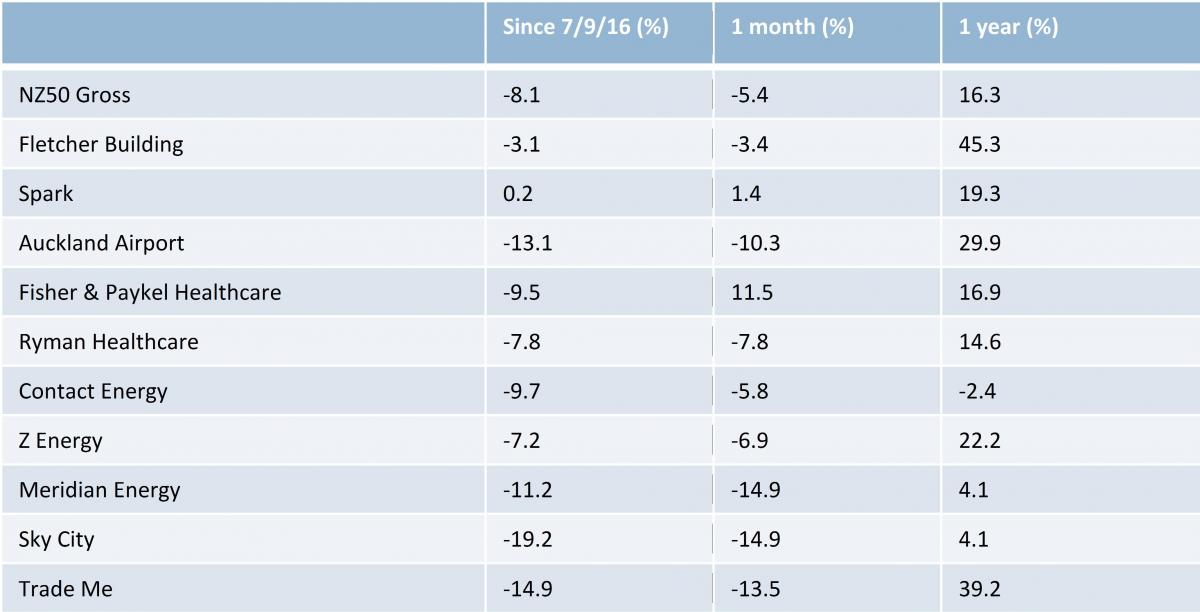
If the thesis is that the selling has been caused by offshore investors divesting “yield risk” (defined as the broader New Zealand market and currency) then there is clearly the chance that a further increase in yields will see more selling. While that remains a risk, it is worth noting that the spread of the equity market’s cash dividend yield to the 5 year New Zealand bond is currently around 225 basis points, close to its widest over the last 10 years, with the exception of the extreme movements during the peak of the Global Financial Crisis. There are a large number of quality defensive businesses that provide dividend yields that are likely to look very attractive even if bond yields rise materially. Examples include Meridian Energy, which has a gross dividend yield of over 9.5%, Contact Energy, gross yield of 6.9% and even Trade Me, a gross yield of 5% and forecast earnings growth of greater than 10%.
Moreover, in the aftermath of the recent selling the market as a whole looks much better value than it did just a couple of months ago. The market 12 month forward price to earnings ratio now sits around 18x, still not cheap relative to history, but certainly much closer to fair value and underlying economic momentum is providing some comfort in the “E” (company earnings) denominator. In the absence of a material weakening in earnings, further market weakness will present opportunities to buy good businesses at increasingly attractive prices.
Nicholas Dravitzki – Portfolio Manager